 Today the Canadian Real Estate Association (CREA) released statistics showing national existing home sales fell 7.4% nationally from April to May 2021, building on the 11% decline in April. Over the same period, the number of newly listed properties fell 6.4%, and the MLS Home Price Index rose 1.0%, a marked deceleration from previous months.
Activity nonetheless remains historically high, but in contrast to March’s all-time record, it is now running closer to levels seen in the second half of 2020 (see chart below). Month-over-month declines in sales activity were observed in close to 80% of all local markets. It was a mixed bag of results, with a slowdown in sales observed in most large markets across Canada.
“While housing markets across Canada remain very active, we now have two months of moderating activity in the books, and that goes for demand, supply and prices,” stated Cliff Stevenson, Chair of CREA. "More and more, there is anecdotal evidence of offer fatigue and frustration among buyers, and the urgency to lock down a place to ride out COVID would also be expected to fade at this point given where we are with the pandemic".
New Listings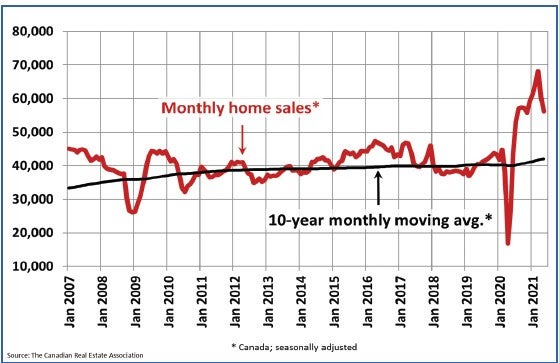
The number of newly listed homes declined by 6.4% in May compared to April. New listings were down in about 70% of all local markets in May.
The national sales-to-new listings ratio was 75.4% in May 2021, down slightly from 76.2% posted in April. The long-term average for the national sales-to-new listings ratio is 54.6%, so it remains historically high; although, it has been moderating since peaking at 90.7% back in January.
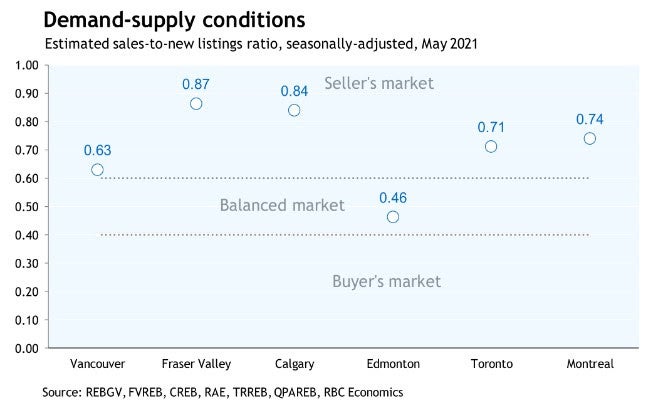
Based on a comparison of sales-to-new listings ratio with long-term averages, only about a quarter of all local markets were in balanced market territory in May, measured as being within one standard deviation of their long-term average. The other three-quarters of markets were above long-term norms, in many cases well above.
As the chart below shows, Edmonton was one market in balance, and the Greater Vancouver Area was moving closer to balance, but others remain a seller's market.
There were 2.1 months of inventory on a national basis at the end of May 2021, up from a record-low 1.7 months in March but still well below the long-term average for this measure of over 5 months.
 Home Prices
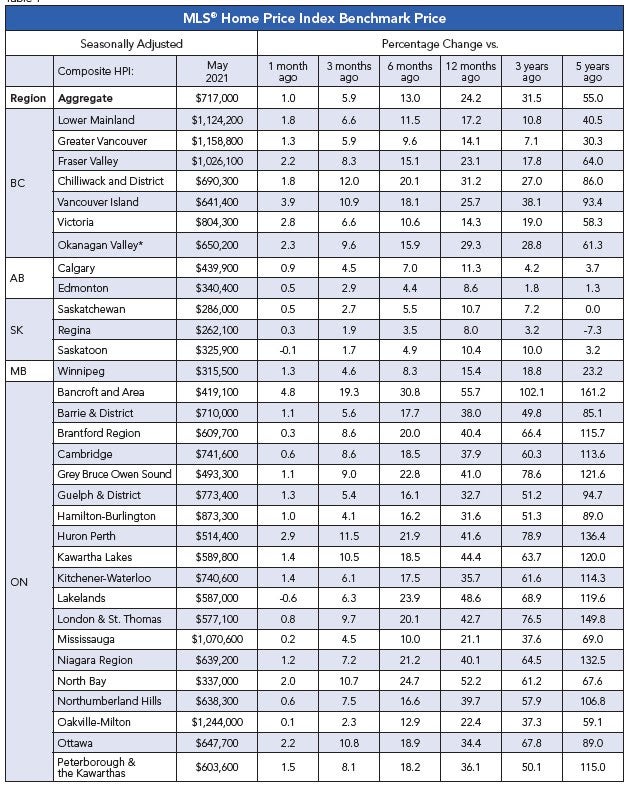
The Aggregate Composite MLS® Home Price Index (MLS® HPI) rose 1% month-over-month in May 2021 – a noticeable deceleration. The most recent deceleration in month-over-month price growth has come from the single-family space compared to the more affordable townhome and apartment segments.
The non-seasonally adjusted Aggregate Composite MLS® HPI was up 24.4% on a year-over-year basis in May. Based on data back to 2005, this was another record year-over-year increase; although, it is not likely to go much higher.
While the largest year-over-year gains continue to be posted across Ontario, this is also where month-over-month price growth has been slowing the most. Meanwhile, price growth has continued to accelerate in some other parts of the country, thus reducing the year-over-year growth disparity between Ontario and other provinces.
 Bottom Line
The near-uniform nature of the housing market activity (in what is usually a highly regionalized market) is still a key feature of this cycle. Indeed, 22 of 26 markets tracked by CREA saw sales fall in May, while all but one market saw the average transaction price up by double-digits from a year ago (sorry, Thunder Bay). Among the tightest markets in the country based on the sales-to-new listings ratio are the Okanagan and Kawartha Lakes; cottage country is still on fire.
The two-month slowdown in Canadian housing is welcome news. The OECD recently released a report showing that New Zealand, Canada and Sweden have the frothiest housing markets in the world. The UK and the US are near the top as well. Clearly, Covid led many around the world to alter their abode, driving prices higher almost everywhere.
Source - Dr Sherry Cooper - DLC