 Today's release of October housing data by the Canadian Real Estate Association (CREA) shows national home sales fell 0.7% month-over-month (m-o-m) from September's record high (see chart below). This is the first decline in five months, as market conditions remained tight and prices continued to rise. Competition remains intense in the detached-home market and townhouses, but condo apartment sales have slowed as new listings surge, especially in the Greater Toronto Area (GTA).
 The small change from September to October reflected gains in about half of all local markets offset by declines in the other half. Among the larger markets, activity was up in Montreal, the Fraser Valley, Calgary and Edmonton. By contrast, sales fell back in the GTA, Hamilton-Burlington, Ottawa and Greater Vancouver.
Actual (not seasonally adjusted) sales activity posted a 32.1% y-o-y gain in October. It was a new record for that month by a margin of more than 14,000 transactions. For the fourth straight month, sales activity was up in almost all Canadian housing markets compared to the same month in 2019. Among the few markets that were down on a year-over-year basis, it is possible for the handful that is in Ontario simply do not have the supply at the moment.
This year, some 461,818 homes have traded hands over Canadian MLS® Systems, up 8.6% from the first 10 months of 2019. In fact, it was the second-highest January-October sales figure on record, trailing only 2016. It is possible that 2020 could prove itself to be a record year for housing activity--certainly in opposition to what many thought when the pandemic hit in March. There is no doubt that COVID-19 has caused many households to uproot and change homes based on their altered lifestyle and working situation. Much of this activity would not have happened had the pandemic not struck.
New Listings
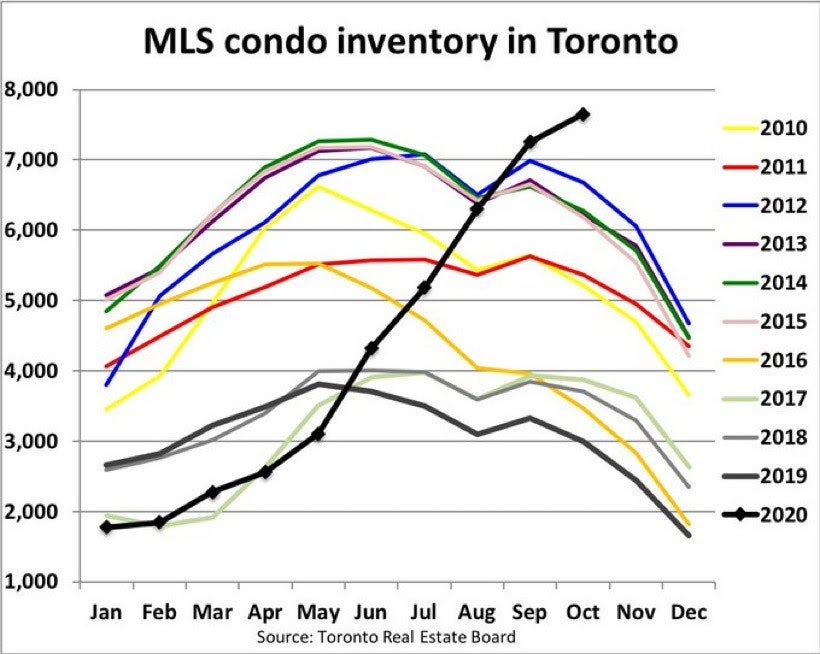
The number of newly listed homes climbed 2.9% in October. The overall gain in new supply in October was driven by more new listings in the GTA, B.C.’s Lower Mainland and Ottawa. As with sales activity, actual (not seasonally adjusted), new listings set a new record for October; however, it was by far less of a margin than sales. Meaning market conditions are still very tight in many parts of the country.The Toronto Real Estate Board reported that the pace of annual sales growth far outstripped growth in new listings in the detached market segment. Conversely, the condominium apartment market segment experienced more than double the new listings than in October 2019, whereas sales were only up by 2.2% over the same period (see chart below).
“Competition between buyers of single-family homes, and particularly detached houses, remained strong last month and continued to support double-digit annual rates of price growth in many GTA neighbourhoods. In contrast, condo buyers have benefitted from much more choice compared to last year. Pre-COVID polling had already pointed to an increase in investor selling in 2020. The pandemic only added to this trend with a stall in economic growth and a halt to tourism impacting cashflows for many investors,” said Lisa Patel, TRREB’s President.
The dearth of tourists has devastated the short-term rental condo market, many of which are listed on Airbnb. And a dramatic decline in immigration hurt the long-term condo rental space. Rents overall have fallen in the GTA, and many investors are trying to sell. As well, many buyers of yet-to-be-delivered new condos are trying to flip their contracts. The federal government initiatives to increase immigration in 2021, if successful, will help remediate this situation. Still, tourism will not open back up until a vaccine is widely distributed around the world. There has been some good news on that front.
With new supply up in October and sales relatively little changed, the national sales-to-new listings ratio eased to 74.3% – still among the highest levels on record for the measure. The long-term average for the national sales-to-new listings ratio is 54.1%.
Based on a comparison of sales-to-new listings ratio with long-term averages, about a third of all local markets were in balanced market territory in October, measured as being within one standard deviation of their long-term average. The other two-thirds of markets were above long-term norms, in many cases well above.
There were just 2.5 months of inventory on a national basis at the end of October 2020 – the lowest reading on record for this measure. At the local market level, some 18 Ontario markets were under one month of inventory at the end of October.
Home Prices
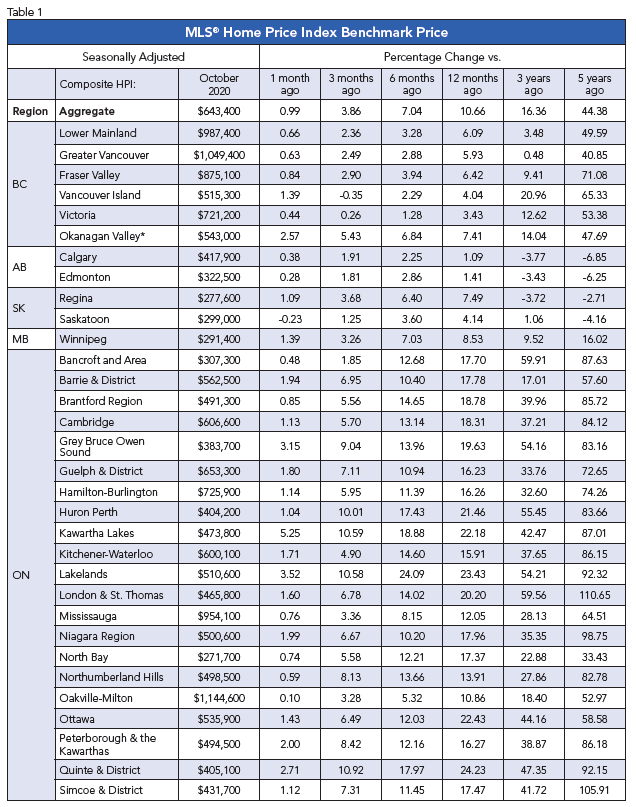
The Aggregate Composite MLS® Home Price Index (MLS® HPI) rose by 1% m-o-m in October 2020. Of the 39 markets now tracked by the index, all but one were up between September and October (see table 1 below).The non-seasonally adjusted Aggregate Composite MLS® HPI was up 10.9% on a y-o-y basis in October – the biggest gain since July 2017.
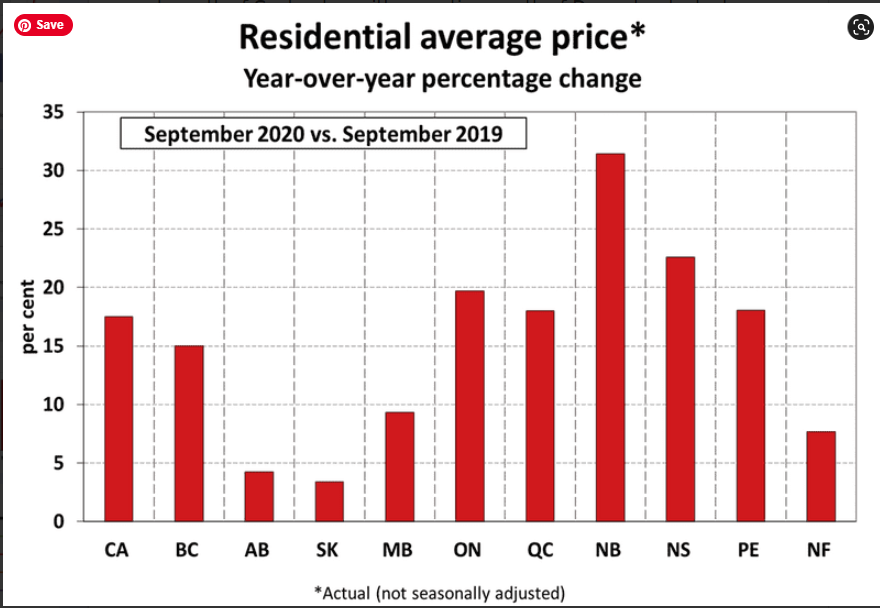
The largest y-o-y gains – more than 25% – were recorded in Ontario's Quinte & District and Woodstock-Ingersoll.
Y-o-y price increases in the 20-25% range were seen in Ottawa, London & St. Thomas, Tillsonburg District and some Ontario cottage country areas.
Y-o-y price gains followed this in the range of 15-20% in Barrie, Hamilton, Niagara, Guelph, Bancroft and Area, Brantford, Cambridge, Huron Perth, Kitchener-Waterloo, North Bay, Peterborough and the Kawarthas, Simcoe & District, Montreal and Greater Moncton.
Prices were up in the 10-15% range compared to last October in the GTA, Oakville-Milton, Mississauga and Northumberland Hills.
Meanwhile, y-o-y price gains were in the 5-10% range in Greater Vancouver, the Fraser Valley, the Okanagan Valley, Regina, Saskatoon, Winnipeg and Quebec City. Gains were less than 4% in Victoria and elsewhere on Vancouver Island, as well as in St. John’s, and prices were just inside positive territory y-o-y in Calgary and Edmonton.
The actual (not seasonally adjusted) national average home price set another record in October 2020, coming in at $607,250. This was up 15.2% from the same month last year.
Bottom Line
Housing strength is largely attributable to record-low mortgage rates and pent-up demand by households that have maintained their income level during the pandemic. The hardest-hit households are low-wage earners in the accommodation, food services, and travel sectors. These are the folks that can least afford it and typically are not homeowners. The good news is that the housing market is contributing to the recovery in economic activity.Since Pfizer's announcement that they have a highly effective vaccine in the works, interest rates in the US have edged upward. This has been mitigated in part by the dramatic surge in COVID cases worldwide and tighter restrictions on activity. This morning, Modernal Inc. said its COVID-19 vaccine was 94.5% effective in preliminary analysis of a large late-stage clinical trial, another sign that a fast-paced hunt by scientists and pharmaceutical companies is paying off with potent new tools that could help control a worsening pandemic. This great news has pushed up the US and Canadian bond yields, leading many to suggest that a rise in mortgage rates can't be far behind. Stock markets are rising sharply, especially in the US, where they are hitting new record highs.
The 5-year Government of Canada bond yield is currently at .45%. It had been as low as .39% recently and .28% over the past year. The good news on the vaccine front may well be overblown given that expanded pandemic restrictions and record cases will dampen economic activity well through the winter months, mitigating the upward pressure on rates. Any mortgage rate increases will be 10 basis points or less, although discounts might start to disappear.
Source - Dr Sherry Cooper - Dominion Lending Center