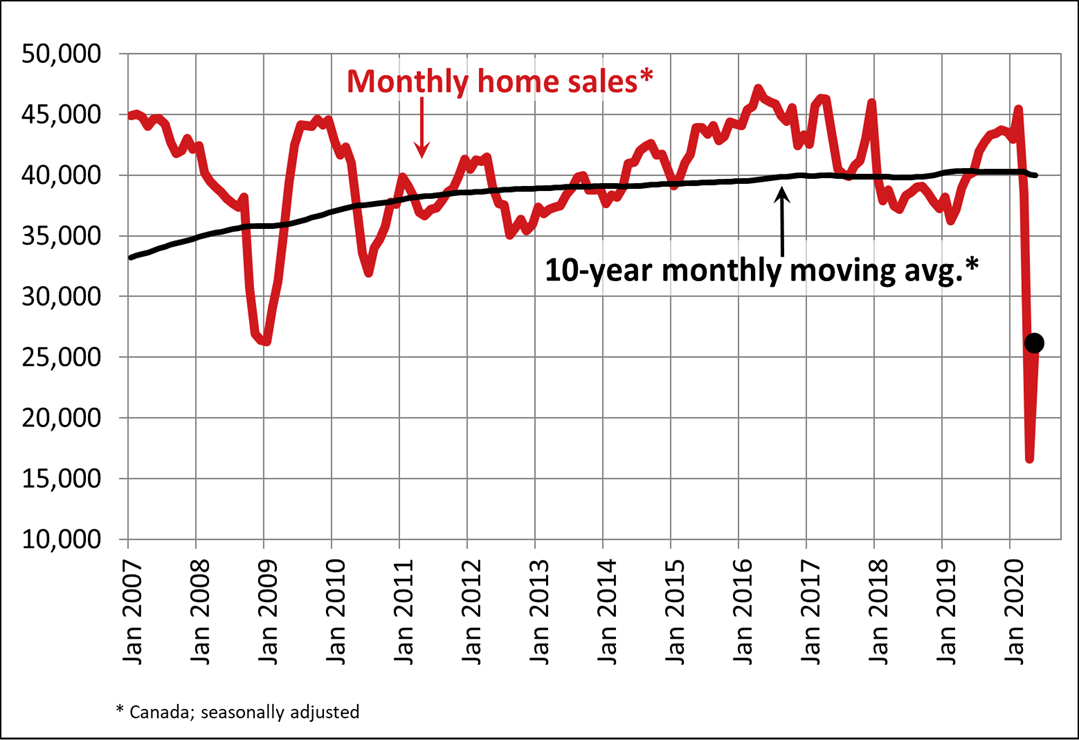
 Statistics released today by the Canadian Real Estate Association (CREA) show national home sales and new listings were up noticeably in May 2020 compared to April, though still historically low at this point.
SUMMARY:
National home sales rose 56.9% on a month-over-month (m-o-m) basis in May.That said, actual (not seasonally adjusted) activity was still down 39.8% year-over-year (y-o-y).
The number of newly listed properties was up 69% from April to May.
However, actual (not seasonally adjusted) new supply was still 38.1% below May 2019.
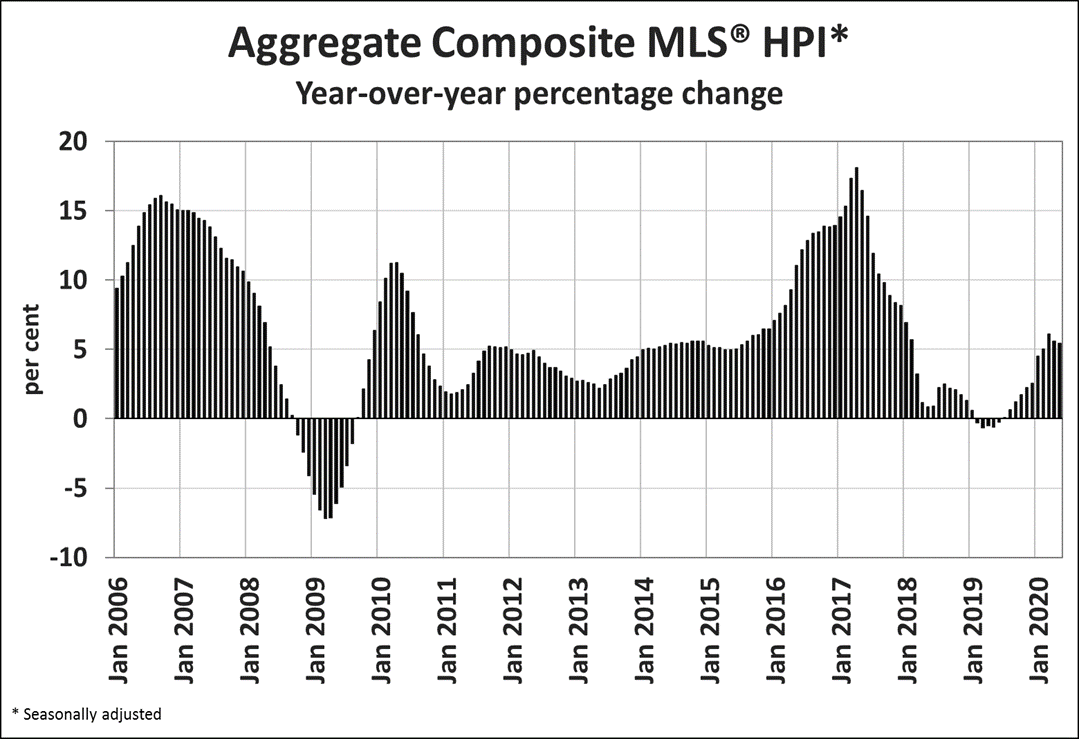
The MLS® Home Price Index (HPI) was unchanged (-0.08%) m-o-m and was still up 5.3% y-o-y.
The actual (not seasonally adjusted) national average sale price fell 2.6% y-o-y.
NATIONAL RESIDENTIAL STATISTICS
Home sales recorded over Canadian MLS® Systems rebounded by a record 56.9% in May 2020; although, that is as a percentage of the weakest month of April on record. As such, the May gain constituted a return of only a third of the activity lost between February and April, and the May 2020 sales figure was still the lowest level for that month since the mid-1990s.
Transactions were up on a m-o-m basis across the country. Among Canada’s largest markets, sales rose by 53% in the Greater Toronto Area (GTA), 92.3% in Montreal, 31.5% in Greater Vancouver, 20.5% in the Fraser Valley, 68.7% in Calgary, 46.5% in Edmonton, 45.6% in Winnipeg, 69.4% in Hamilton-Burlington and 30.5% in Ottawa.
In most cases, the sizes of the increases listed above were somewhat proportional to the size of declines recorded in April, and because it requires exponentially larger increases to recover from larger declines, some of the markets with the smaller gains in May but also smaller declines in April are currently doing better relative to history.

Actual (not seasonally adjusted) sales activity was still running 39.8% below last May, marking the lowest May sales figure since 1996. y-o-y declines in the larger markets were clustered in the 40%-50% range.
“REALTORS® across Canada are pleased to note increases in home sales and new listings across the country in May,” stated Costa Poulopoulos, Chair of CREA. "We continue to help clients stay safe by complying with government directives and advice, and continue using technology to list and show properties, as well as completing all required forms. REALTORS® remain the best source for information and guidance when negotiating the sale or purchase of a home in these extraordinary times,” continued Poulopoulos.
“May’s housing numbers are certainly a mixed bag of results – sales and new listings are both way up month-over-month but still way down compared to year ago,” said Shaun Cathcart, CREA’s Senior Economist. “The big picture is things are moving in the right direction but still have a long way to go. That said, under the surface those numbers have been steadily rising from mid-April right through the first week of June, so June may end up a similar story. With sales and new listings moving down and now back up in tandem, and overall supply still falling, prices appear to be holding firm at this point.”
The number of newly listed homes climbed by a record 69% in May compared to April. As with sales activity, gains were recorded across the country.
With new listings having recovered by more than sales in May, the national sales-to-new listings ratio fell to 58.8% compared to 63.3% posted in April. While this statistic has moved lower, the bigger picture is that this measure of market balance has been remarkably little changed considering the extent to which current economic and social conditions are impacting both buyers and sellers.
The number of months of inventory is another important measure of the balance between sales and the supply of listings. It represents how long it would take to liquidate current inventories at the current rate of sales activity.
There were 5.6 months of inventory on a national basis at the end of May 2020, down from 9 months in April. The temporary jump in this measure recorded in April reflected the fact that sales were expected to fall right away amid lockdowns; whereas, other variables like active listings would be expected to fall at a much slower pace. Anecdotal evidence suggests many sellers who already had homes on the market before mid-March may have left the listings up for now but drastically curtailed the extent to which they are actively trying to sell during the lockdown. With many of those now coming off the market, overall active listings have fallen by about a quarter as of the end of May, bringing them down among the lowest levels on record for that time of the year.
The Aggregate Composite MLS® Home Price Index (MLS® HPI) was unchanged (-0.08%) in May 2020 compared to April.

Of the 19 markets currently tracked by the index, 18 posted either m-o-m increases or smaller decreases compared with April, including 5 that saw a gain in May following a decline in April.
Generally speaking, since the COVID crisis began small declines in prices have been seen in British Columbia while declining trends already in place in Alberta have accelerated. Across the rest of the Prairies, where sales have been doing comparatively much better against history than in much of the country, price trends have actually been stabilizing.
The Greater Golden Horseshoe has generally seen it’s rapidly accelerating prices put into a stall for now, while further east in Ottawa, Montreal and Moncton, prices appear to have been able to continue climbing albeit at a slower pace.
The non-seasonally adjusted Aggregate Composite MLS® HPI was still up 5.3% on a y-o-y basis in May.
The MLS® HPI provides the best way to gauge price trends because averages are strongly distorted by changes in the mix of sales activity from one month to the next.
The actual (not seasonally adjusted) national average price for homes sold in May 2020 was $494,500, down 2.6% from the same month the previous year.
The national average price is heavily influenced by sales in the Greater Vancouver and the GTA, two of Canada’s most active and expensive housing markets. Excluding these two markets from calculations cuts almost $94,000 from the national average price, trimming it to about $401,000.
In the months ahead, the extent to which sales fluctuate in these two markets relative to others could have large compositional effects on the national average price, both up and down. For example, the national average price in May 2020 was likely held lower by a relatively large sales rebound in Montreal and some other relatively more affordable markets. Indeed, the share of seasonally adjusted national home sales made up by the provinces of British Columbia and Ontario hit its lowest level on record in May 2020.
Source - CREA
